
Debt headlines can sound like they describe everyone. They don’t. National totals combine many different households, loan types, and circumstances. Understanding what is included, and what isn’t, makes the numbers easier to read without treating them as a verdict on any one family.
As of August 2026, Equifax’s estimate put total U.S. consumer debt at roughly $18.45 trillion. About 74.2% was mortgage debt, leaving approximately $4.76 trillion in non-mortgage debt. The non-mortgage mix included auto loans, student loans, credit-card balances, and other forms of credit.
Join the Inner Circle / Subscribe for weekly updates
Get insider access to clear, practical financial education and exclusive financial clarity insights, explained in plain language, without pressure. If you subscribe, you can opt out at any time using the unsubscribe link in an email.
What counts as mortgage debt, and what doesn’t?
Mortgage debt is borrowing secured by residential property. The category can include a primary mortgage and certain home-equity borrowing, depending on the data source and how it defines the total.
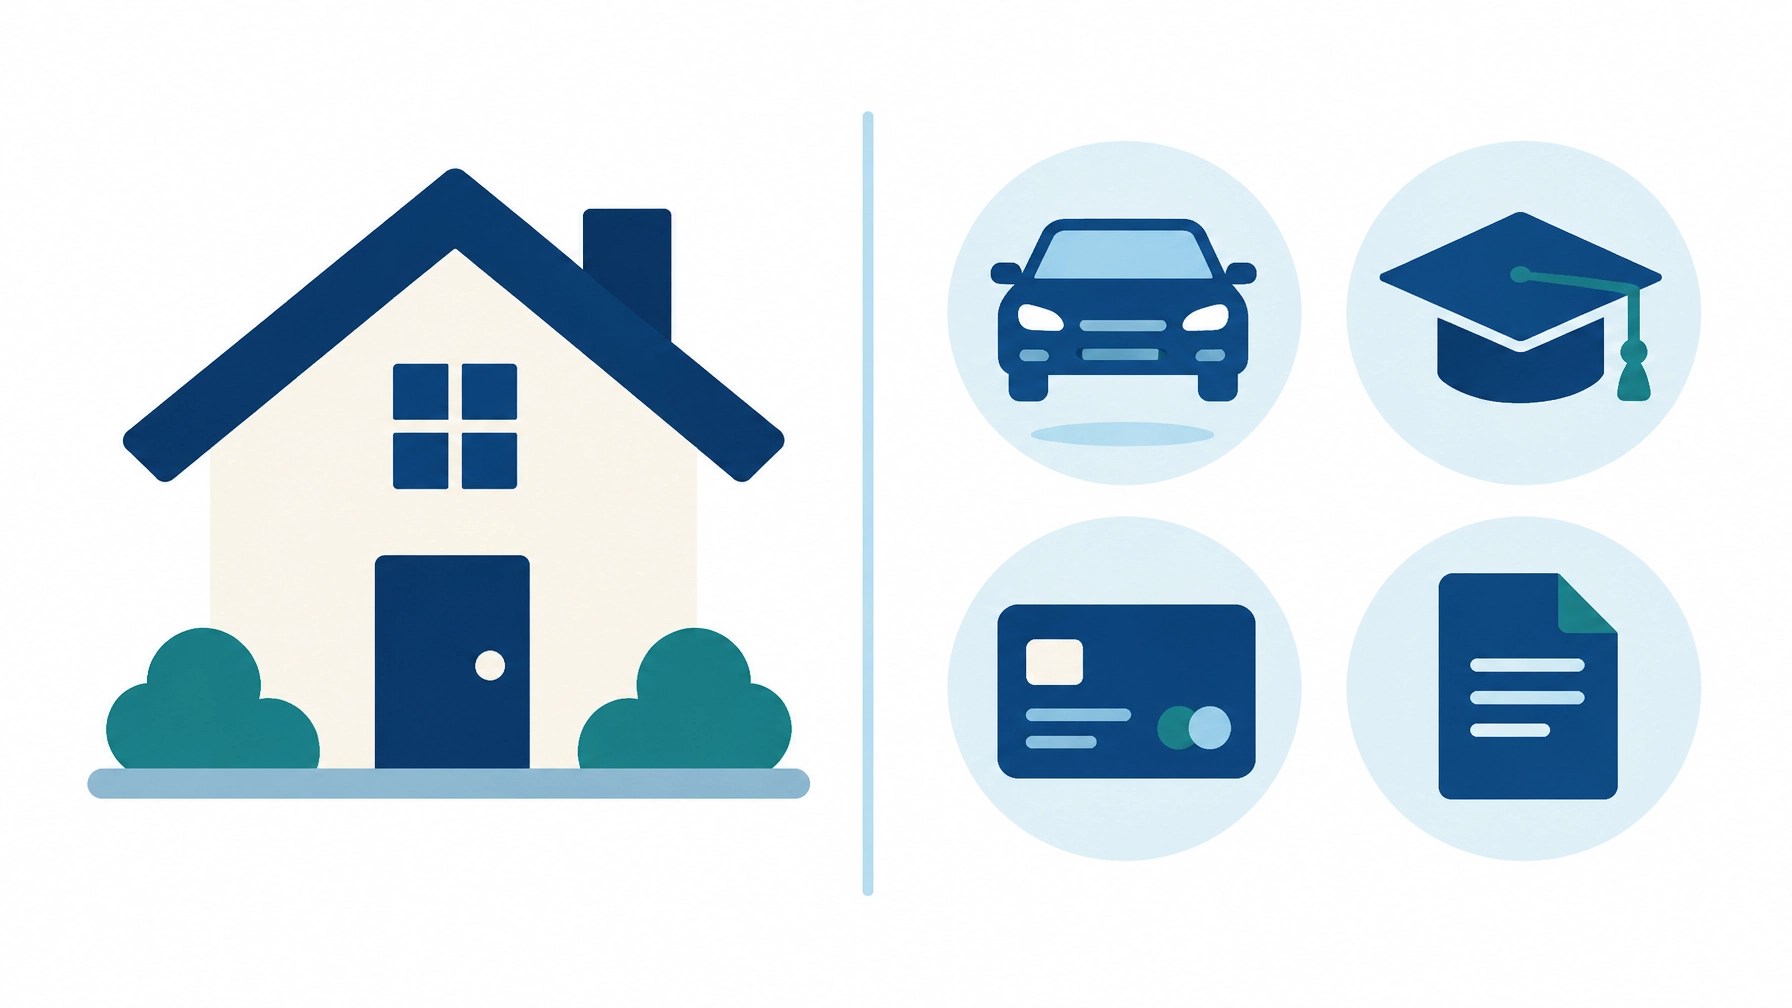
Non-mortgage debt covers other types of borrowing. The August 2026 Equifax report grouped it into four broad categories:
- Auto loans and leases: about 36.4% of non-mortgage debt.
- Student loans: about 26.9%.
- Credit-card balances: about 24.6%.
- Other products: the remaining share.
Those percentages describe the composition of the national non-mortgage total, not the share of debt held by every individual or family.
The source matters, too. Equifax’s broad household-debt measure and the Federal Reserve’s G.19 Consumer Credit report are not interchangeable. The Federal Reserve’s G.19 series excludes mortgages and measures consumer credit in its own categories and reporting framework. Its August 2026 release showed nonrevolving credit rising at a 4.1% annualized rate, while revolving credit declined at a 4.2% annualized rate.
An annualized rate is a way of expressing the pace of change over a short period as if that pace continued for a full year. It is not the percentage of a household’s debt that changed, and it is not a forecast.
Sources: Equifax’s August 2026 U.S. National Consumer Credit Trends Report and the Federal Reserve’s August 2026 G.19 release.
Why the mix matters more than one headline number
A single debt total can flatten important differences. Mortgage borrowing, an auto loan, student debt, and credit-card balances do not all work the same way. They can have different purposes, repayment structures, terms, and reporting patterns.
Looking at the mix helps explain what is driving a broad change. For example, the Federal Reserve’s August figures showed revolving and nonrevolving credit moving in different directions. A reader who sees only “consumer credit changed” would miss that distinction.
It is also important not to combine figures from separate reports as if they form one simple ledger. Each source has its own coverage, definitions, and timing. A broad household-debt estimate that includes mortgages cannot be directly added to a Federal Reserve consumer-credit figure that excludes them. When comparing statistics, check the source, date, categories, and measurement before drawing conclusions.
Auto and student loans are different from revolving balances
Auto and student loans are generally installment debts: the borrower typically receives a defined amount and repays it over time under the loan’s terms. The details vary by loan, and the national category does not tell us the terms for any one borrower.
Credit cards are commonly classified as revolving credit. The account has a credit limit, and balances can change as purchases, payments, and other activity occur. A reported card balance is an aggregate measurement; it does not tell us whether every cardholder carries a balance from month to month or how any one person uses a card.
That distinction helps explain why the categories may shift differently in monthly reports. Nonrevolving balances can move with activity across loans such as auto and student borrowing, while revolving balances respond to credit-card activity and payments. A national trend describes the combined movement across the population. It does not explain the reason for each person’s borrowing or balance.

National figures are not a picture of your household
The $18.45 trillion estimate is an aggregate. It combines debts held by many households across the country, each with different circumstances. It does not show how much an individual owes, whether a particular balance is manageable, or what someone’s financial future will look like.
The same caution applies to category shares. If auto loans make up about 36.4% of non-mortgage debt nationally, that does not mean they make up 36.4% of every family’s debt. Some households may have no auto loan; others may have balances in several categories. An average or national share cannot tell those stories.
For personal context, people often begin by identifying what appears in their own records: the type of account, the reported balance, the payment terms, and the date the information was updated. Comparing those details with a national figure can help clarify the difference between a broad trend and an individual situation. It does not, by itself, determine what someone should do.

A plain-language way to review the categories
A household snapshot can be easier to understand when each item is considered separately. Some neutral questions for interpreting records include:
- Is this account related to housing, or is it non-mortgage borrowing?
- Is the balance part of an installment loan or a revolving account?
- What reporting date does the statement or credit record show?
- Does the figure describe an amount owed, a credit limit, or a payment?
- Am I comparing a personal record with a national total, or with a statistic that uses a different definition?
These questions are about understanding labels and context; they are not a recommendation about borrowing, repayment, or financial decisions. For account-specific questions, the relevant account provider or a qualified professional can explain the terms that apply to that account.
The takeaway
The household debt mix is more informative than a headline total alone. In August 2026, Equifax’s broad estimate placed U.S. consumer debt at about $18.45 trillion, with mortgages making up roughly 74.2% and non-mortgage debt about $4.76 trillion. Within the non-mortgage category, auto, student, and credit-card balances made up the largest reported shares.
Separately, the Federal Reserve reported that nonrevolving consumer credit rose at a 4.1% annualized rate in August, while revolving credit declined at a 4.2% annualized rate. These are national statistics from specific data sources, not individualized assessments and not predictions.
Educational content only, not financial, tax, credit, debt, or lending advice. No guarantees of savings, approval, income, or financial results.
Disclosure: Lamont Milbourne is an independent MWR Financial marketing participant and may earn referral compensation from eligible enrollments. Specific savings, credit outcomes, or earnings are not guaranteed.
Want to review the MWR information?
Request an MWR overview to learn about the membership structure, service categories, and current official enrollment information. You can ask questions before deciding whether to take any next step. Please do not send account numbers, Social Security numbers, credit reports, or other sensitive financial information.
Want me to send you the information so you can review how it works?
Reply INFO and I’ll send the next step.
Or call Rachel at +1 (227) 295-2046 to get routed to the right person.
Leave a Reply